What is NTI and why every Illinois VGT operator obsesses over it
If you've spent ten minutes around Illinois video gaming, you've heard the abbreviation NTI — Net Terminal Income. It's the metric that drives every conversation about a venue's performance, its tax bill, its lease negotiations, and its acquisition price. If you only learn one thing about IL VGT economics, learn this one.
The definition
Net Terminal Income is the amount of money the machine kept after paying out winnings to players. It's the gross revenue the gaming floor produced — before the state, the municipality, the terminal operator, and the establishment owner divide it up.
The math is straightforward:
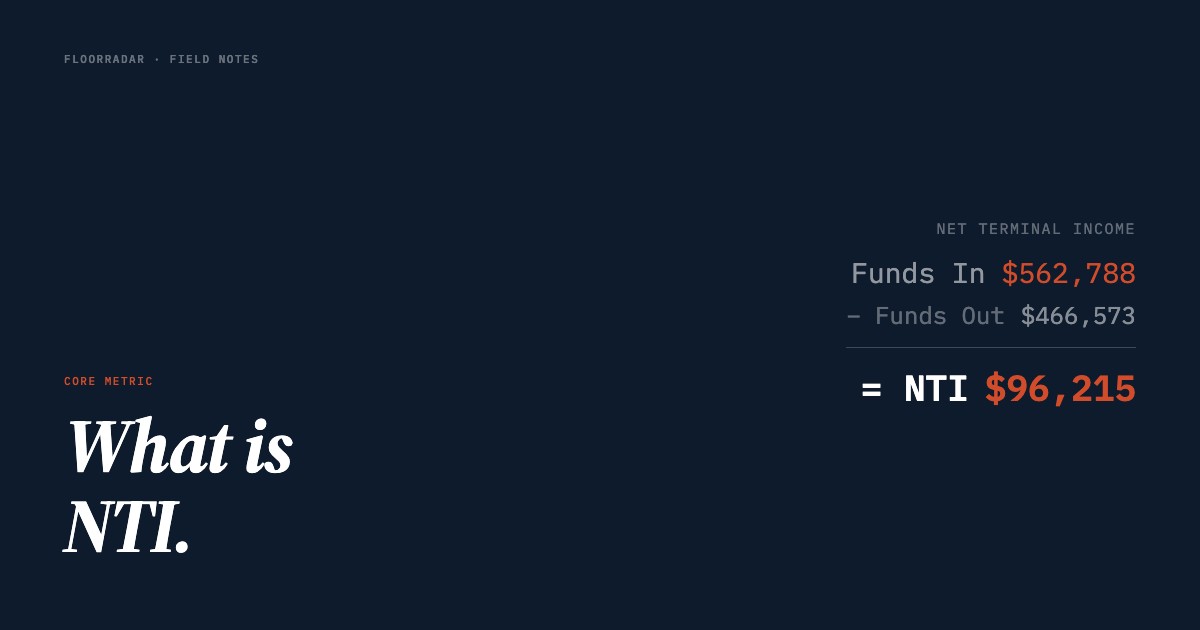
- Funds In — every dollar that entered the bill validators
- Funds Out — every dollar paid out as ticket vouchers
- NTI = Funds In − Funds Out
That's it. The state market reports this number monthly per establishment, and it's the foundation of every other number in the gaming industry's regulatory paperwork.
What NTI is NOT
This is where new operators get confused. NTI is a *gaming-floor* number. It does not include:
- Food and beverage revenue — that's separate, and it's all yours
- Liquor sales — same
- Door cover, ATM fees, vending — separate
- Your operating costs — labor, lease, insurance, utilities all come out of *your* share of NTI plus any non-gaming revenue
NTI is gross gaming revenue. It's what you'd pay tax on if you owned every machine outright. You don't — Illinois law requires a licensed Terminal Operator owns the machines — so you split NTI with the TO, the state, and the municipality before you see a dollar.
The split (simplified)
For most Illinois operators, the rough math after all four parties take their cut:
- State of Illinois: ~35% (graduated by NTI tier — see the tax tiers explainer)
- Municipality: ~5% (varies; non-home-rule may be 0%)
- Terminal Operator: ~5% (varies by your TO contract)
- Establishment owner (you): the remainder, roughly 35% of NTI
That's why operators say "$30K NTI" but mean "about $10K-$11K in my pocket per month after the state's share, the muni's share, the TO's share, and before my own operating costs." NTI is the headline number that everyone reports because it's the one that's public on the monthly market report. Operator pocket is the number that pays your bills.
Why operators obsess over it
Three reasons:
1. It's public. The state regulator publishes NTI per establishment every month. That means every operator can see every other operator's NTI. Your number is benchmarked publicly whether you like it or not.
2. It's the basis of everything. Your tax bill, your TO's revenue, the lease conversations you have with your landlord, the offer you'll get if you ever sell — all anchored on NTI.
3. Small differences compound. A venue grossing $30K monthly NTI versus $40K monthly NTI is a ~$120K/year difference in operator pocket. That's the difference between "this is a side income" and "this funds my next venue acquisition." Operators who track NTI weekly know exactly where they sit.
What "good" looks like
The Illinois midpoint is around $25K-$45K monthly NTI per establishment. Below $20K and the venue is probably struggling — labor and lease eat the operator pocket faster than it accumulates. Above $50K and you're in the upper third of Illinois operators. Above $80K consistently and you're a target for acquirers (more on that in the monthly market report explainer).
The number that *really* matters for benchmarking isn't raw NTI — it's NTI per VGT. Illinois caps each licensed establishment at 6 terminals. So a venue grossing $30K NTI on 6 machines (~$5K per terminal) is performing differently than a venue grossing $30K on 4 machines (~$7.5K per terminal). The latter has room to grow by adding terminals; the former has a saturated floor.
Year-over-year vs month-over-month
Gaming revenue is seasonal. November-March is typically strong; June-August is typically softer. Comparing this March to last March (year-over-year) tells you whether the venue is structurally up or down. Comparing this March to this February (month-over-month) tells you whether the seasonal rhythm is on track. Both matter, but for different decisions.
If your YoY is up but your MoM is flat, you're growing along with the market. If YoY is up and MoM is up, you're outperforming the market. If YoY is down, something structural changed — new competition, lost regulars, lease pressure. NTI alone doesn't tell you which; you need the local-market context to interpret it.
How FloorRadar uses NTI
Every chart, every dashboard, every comparison in this product is built around NTI as the primary metric. Our validation pipeline reconciles, normalizes, and enriches it through proprietary algorithms; the dashboard surfaces the views operators actually want — your venue's NTI vs the venues within a 2-mile radius, your YoY trend vs the market's YoY trend, the under-performing venues nearby that might be acquisition candidates.
The starting point is always NTI. It's the one number everyone agrees on. Everything else is interpretation.
Want to see your venue's NTI alongside your local market's? See the preview with synthetic data or create a free account.