What the monthly market report tells you about your competition
Every month, the state gaming regulator publishes a CSV. Every licensed venue in the state, every dollar of net terminal income, every dollar of funds in. It's the most useful public data available for anyone running or evaluating a VGT-licensed business — and most operators look at their own line, maybe their direct neighbor's, and close the file. The rest of the file is telling you a lot more than that.
What's in the report
For each licensed VGT venue and each monthly reporting period, the report includes:
- Funds In: total money inserted into the machines that month. The volume number.
- Funds Out: total winnings paid back to players.
- Net Terminal Income (NTI): the difference. The revenue number.
- Amount Played: total wagered including replayed winnings (so always higher than Funds In).
- Amount Won: total returned to players.
- VGT Count: how many machines this venue runs.
- NTI Tax / State Share / Municipality Share: the splits the state, municipality, and others took.
Plus venue identifiers (license number, establishment name, municipality) and the reporting month + year. About 8,500 rows per month, totaling ~330,000 rows of historical data going back to 2013.
Signal #1: NTI per VGT
Two venues with the same NTI but different VGT counts are doing very different things. A 6-VGT venue at $30,000/month NTI ($5,000/VGT) is performing well. A 3-VGT venue at the same NTI ($10,000/VGT) is over-performing. A 6-VGT venue at $15,000/month NTI ($2,500/VGT) is under-performing — possibly an acquisition target.
Sort the report by NTI/VGT and you're looking at venue efficiency, not raw size. The top quartile is who you want to learn from. The bottom quartile is who an acquirer wants to call.
Signal #2: Trends over consecutive months
A single month is noise. Three months of declining NTI on a venue that previously held steady is a story. The story might be:
- A new competitor opened nearby
- The owner is getting sick or distracted
- Their TO contract changed and the machine mix shifted
- A municipality regulation changed (new hours restrictions, for example)
- The neighborhood's anchor tenant closed (gas station, grocery store, etc.)
You can't tell from the data alone which story it is — but the data tells you a story is happening. That's the cue to research.
Signal #3: Same-municipality benchmarking
Comparing your venue to the IL state average is mostly noise. Comparing to your municipality's average is signal. If you're at $30,000/month NTI and your municipality average is $35,000/month, you're 14% behind your local market. That's a real gap, and it's actionable — the gap might be your machine mix, your hours, your foot traffic, your TO. If your municipality average is $20,000/month and you're at $30,000, you're crushing it locally and the question becomes whether the local market itself can grow.
Signal #4: License-number turnover
License numbers that appear in the data and then stop appearing are venues that closed or transferred ownership. Track them across 24 months and you have a list of deals that already happened. The buyer of each transferred venue is, by definition, an active acquirer. That's a market intelligence list you can build from public data — if you have the patience to do it manually.
Signal #5: Terminal Operator concentration
Not in the monthly report itself, but cross-referenced with the state licensee data: which TO services which venue. Patterns emerge. Certain TOs have stronger placement networks; their venues outperform. Other TOs have weaker networks; their venues underperform on average. If you're an operator considering a TO switch, this is the data you'd want first.
Why most operators don't extract this
The monthly market report is hostile in three ways:
- It's wide. ~8,500 rows per month means an Excel sheet with 4 years of history is ~400,000 rows.
- It's text. Municipality names like "ELK GROVE VILLAGE" and "Elk Grove Village" don't sort the same way without normalization.
- It doesn't compute. NTI per VGT, percentile ranks, trailing-3-month deltas — you have to build all of these yourself.
This is why most operators treat the report as a one-line lookup. The data is gold; the format is hostile.
How FloorRadar handles it
FloorRadar's validation pipeline reconciles and normalizes market data, runs anomaly detection against historical baselines, computes per-VGT and per-municipality benchmarks via proprietary algorithms, and surfaces the signals above as tabs in the dashboard. See the workflow with synthetic data — no signup needed.
The point isn't to replace your own analysis. It's to remove the spreadsheet step so the analysis is what you spend your time on.
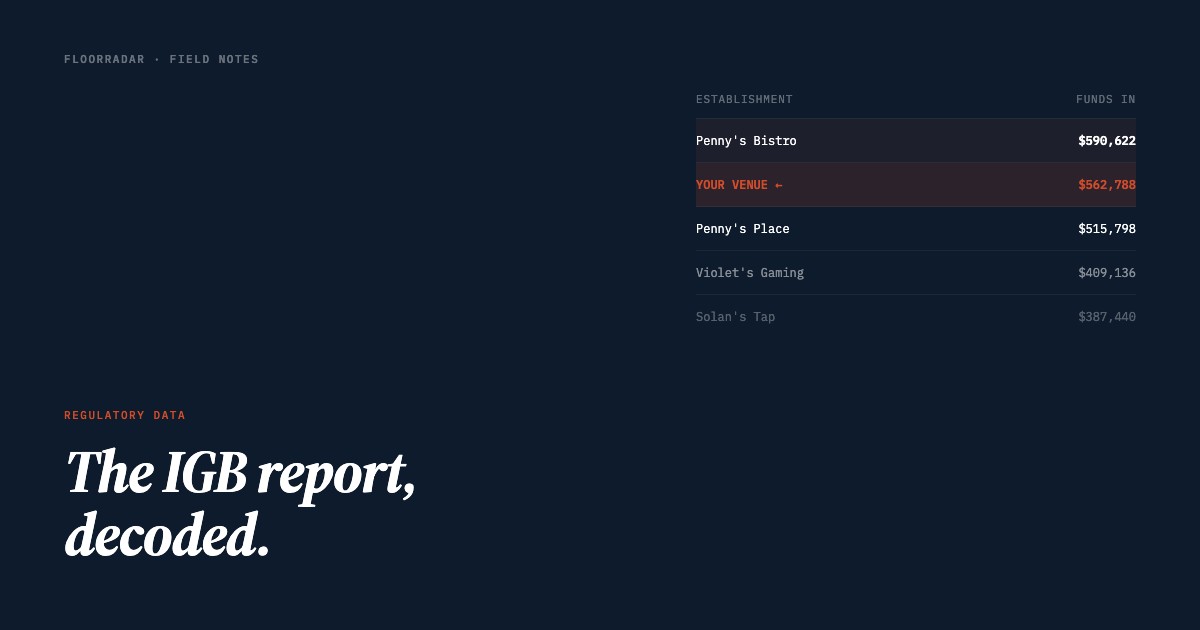
See your venue and your competitors in one view
FloorRadar runs every signal above automatically. Free preview, no signup.